Different spatial scales
This is another research of my PhD. In this example, I want to present and discuss how satellite images in different spatial, spectral and temporal resolutions can affect the representation of the spatial variability of soil properties.
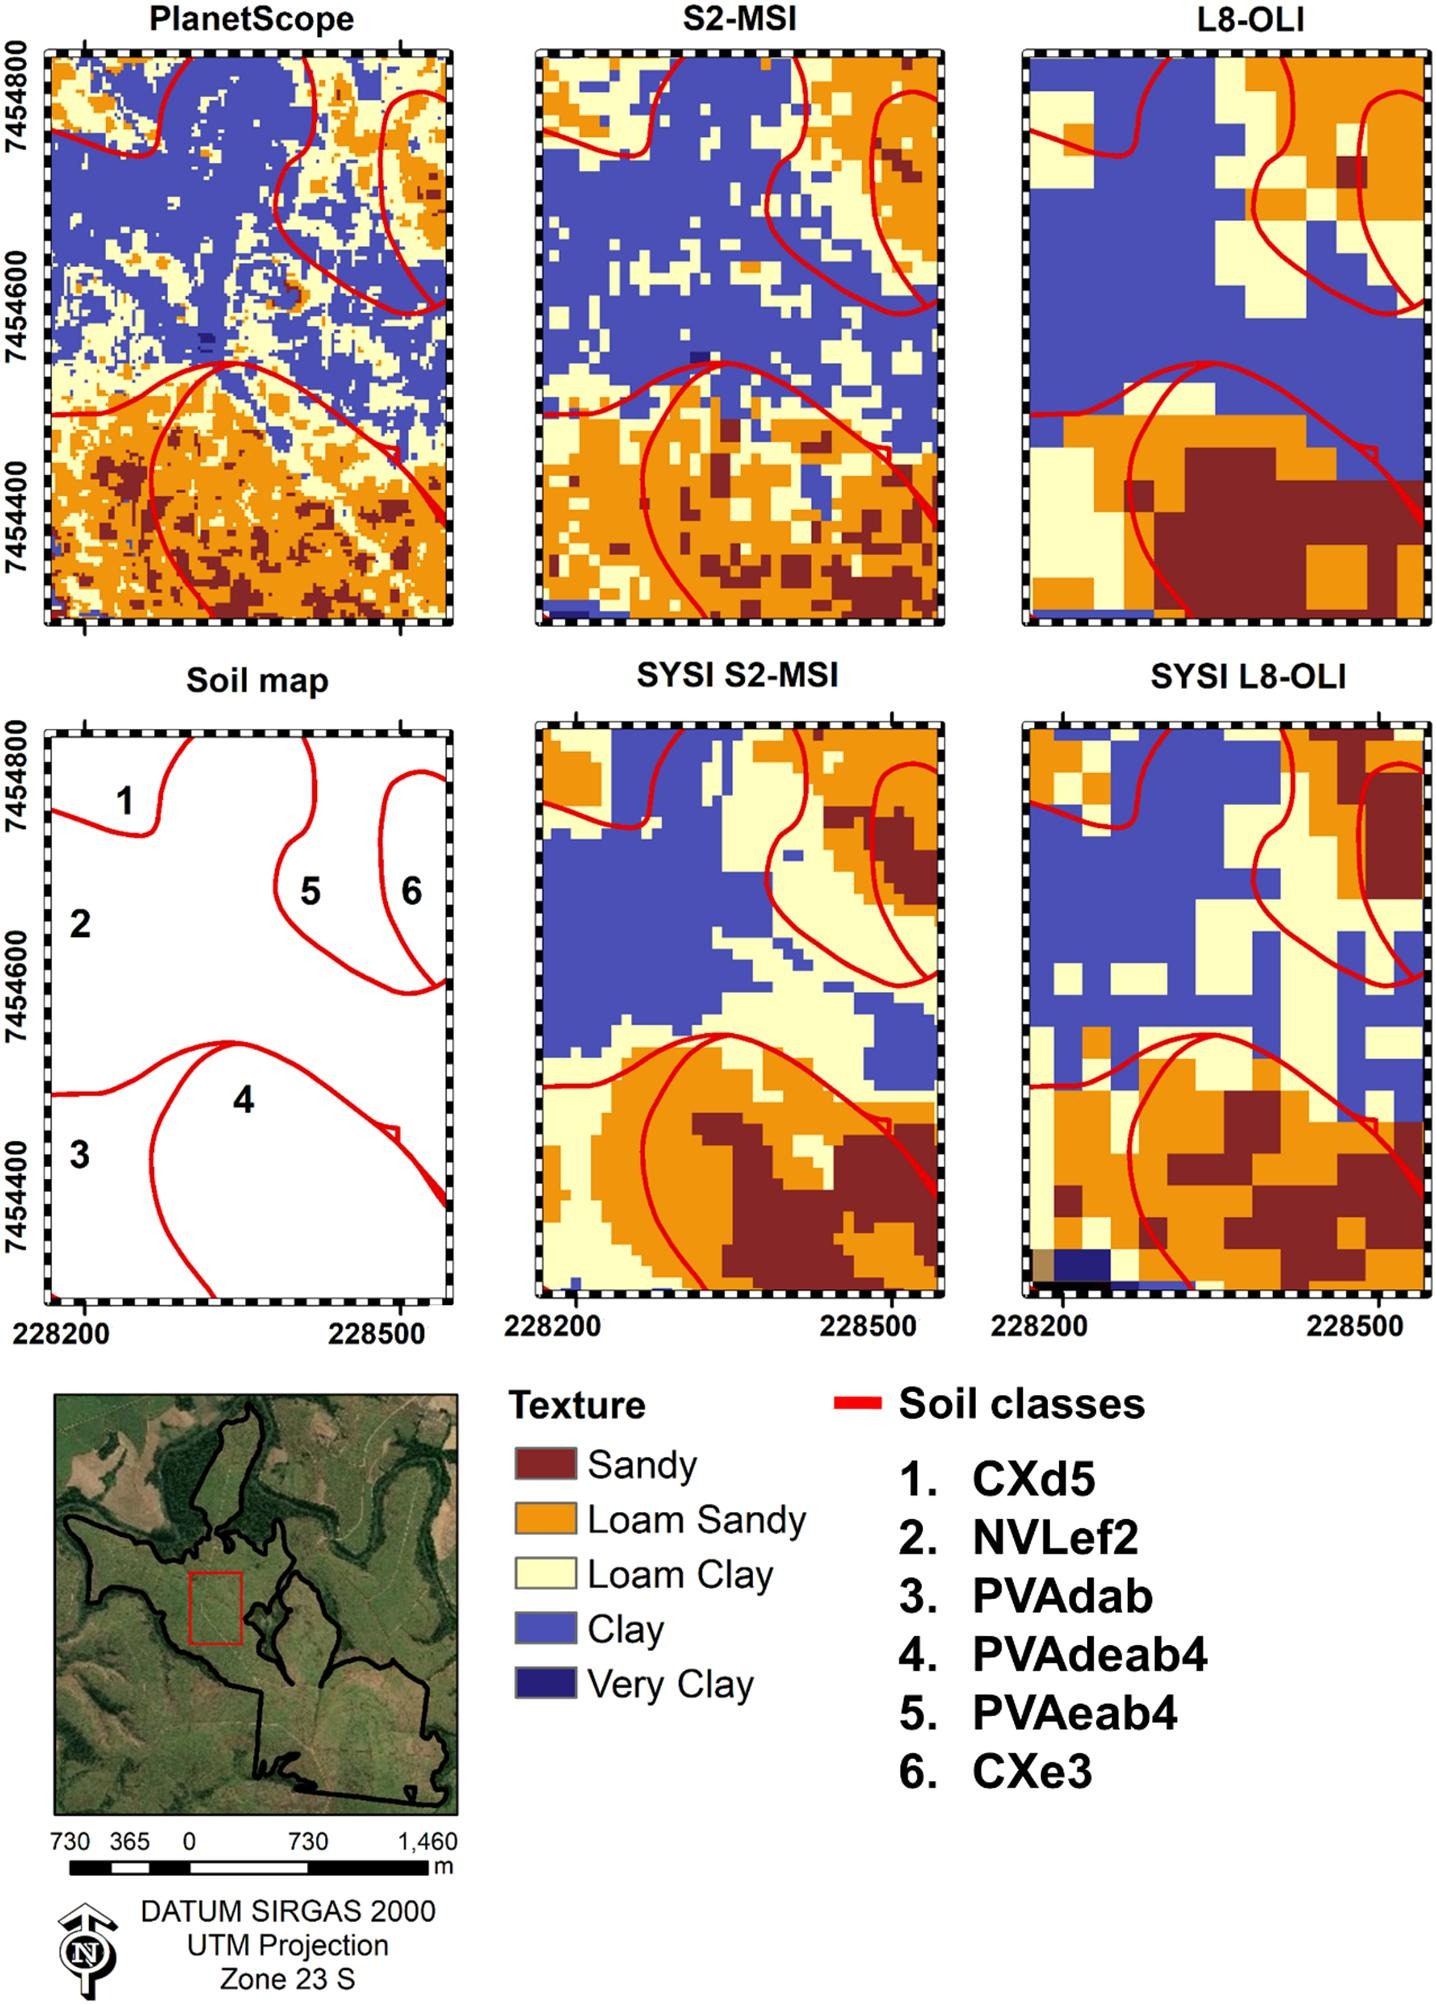
In the figure presented below, you can see a zoom in a small rectangle of an area in southeastern Brazil, specifically in Rafard city. Me and the co-authors of this research tested five satellite images in different resolutions for mapping topsoil properties:
- Landsat-8 of a single-day (L8-OLI October 2017)
- Sentinel-2 of a single day (S2-MSI November 2017)
- PlanetScope of a single day (PS November 2017)
- Landsat bare soil image (SYSI L8-OLI, median reflectance spectra of a time series of four years)
- Sentinel bare soil images (SYSI S2-MSI, median reflectance spectra of a time series of four years).

In the figure, we are presenting the maps of soil texture, obtained from each of the images used, after applying machine learning, training the data and predicting the values for the whole area. We can easily observe the differences.